英語プレゼン本編は何とか乗り切れても、質疑応答で予想外の質問が飛んできた瞬間、言葉が出なくなる。あの沈黙の数秒間が、何より怖い——そんな経験をした社会人は少なくありません。
この症状の原因は、英語力不足ではなく「質疑応答の型」を持っていないことです。質問を受ける・答える・かわす・仕切る、この4つの場面に対応するフレーズを事前に準備しておくだけで、あの恐怖は大幅に軽減されます。
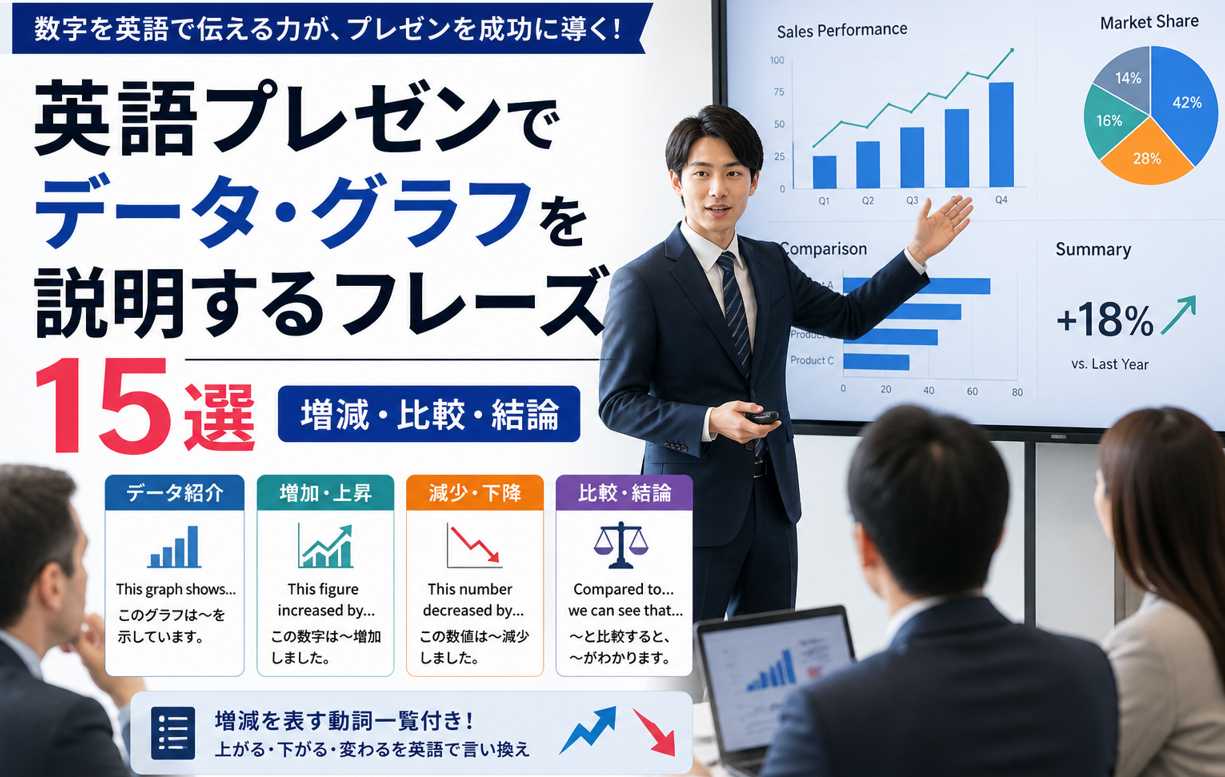
この記事では、英語プレゼンの質疑応答で実際に使える15のフレーズを場面別に整理し、すべて音声付きでお届けします。
🎯 質問を受ける|好印象を与える3つの定番フレーズ
質問を歓迎する一言で、聴衆との信頼関係が一気に変わります。
質問が来た瞬間に「ありがとう」と返せるだけで、場の空気が味方に変わります。回答の中身を考える時間も稼げる、一石二鳥のテクニックです。
ネイティブ発音|リスニング練習対応
1. That’s a great question. Let me address that.
素晴らしいご質問です。お答えします。
2. Thank you for raising that point.
その点を挙げていただきありがとうございます。
3. I’m glad you asked that.
その質問を待っていました。
💡 使い分けのコツ:1は万能型。2は相手の発言を評価したい時。3はやや親しみのある場面向き。迷ったら1を使えば間違いありません。
💡 質問に回答する|論理的に伝える4つのフレーズ
「質問の意図を確認→結論→補足」の順で答えれば、英語でも論理的に聞こえます。
回答で重要なのは、流暢さではなく構造です。質問を確認し、結論を先に述べ、必要なら具体例を添える。この流れを守れば、多少つっかえても説得力は落ちません。
4. To answer your question directly,…
ご質問に直接お答えすると…
5. If I understand correctly, you’re asking about…
正しく理解していれば、〜についてのご質問ですね。
6. Let me give you a concrete example.
具体的な例を挙げましょう。
7. As I mentioned earlier, the key factor is…
先ほど述べた通り、重要な要素は…
⚠️ 注意:質問の意図がわからないまま答え始めるのが最大のミスです。少しでも不明なら、5のフレーズで確認を入れてから回答しましょう。
🛡️ 答えられない時の対処法|誠実にかわす3つのフレーズ
「わかりません」ではなく「後日回答します」と伝えれば、信頼を失いません。
すべての質問に即答できるプレゼンターはいません。答えられない時に沈黙するのが最悪で、「今はわからないが、必ずフォローする」と明確に伝えるのがプロの対応です。
8. That’s outside the scope of today’s presentation, but I’d be happy to follow up.
本日のプレゼンの範囲外ですが、後日フォローさせてください。
9. I don’t have the exact figures right now, but I’ll get back to you.
正確な数字は手元にありませんが、後ほどご連絡します。
10. Let me look into that and share the details by email.
調べてメールで詳細をお伝えします。
💡 ポイント:8は「範囲外」と明示する場面、9は数字を求められた場面、10は調査が必要な場面で使います。いずれも「フォローアップする」という約束を必ずセットで伝えてください。
🔄 質疑応答を仕切る|進行をコントロールする5つのフレーズ
質疑応答は「答える場」ではなく「仕切る場」です。進行の主導権を握りましょう。
質疑応答が長引いてグダグダになるのは、質問に受け身で対応しているからです。タイミングの宣言、残り時間の提示、確認、締めの4段階を自分から仕切ることで、プレゼン全体の印象が格段に上がります。
11. I’ll take questions at the end.
質問は最後に受け付けます。
12. We have time for one more question.
もう1つだけ質問を受け付けます。
13. Does that answer your question?
ご質問への回答になっていますか?
14. Any other questions before we wrap up?
終了前に他にご質問は?
15. I’ll share the slides and my contact info after the session.
セッション後にスライドと連絡先をお送りします。
💡 進行の流れ:プレゼン冒頭で11を宣言 → 質疑応答中に13で確認 → 12で残り時間を示し → 14で最終確認 → 15で締める。この5ステップを覚えておけば、質疑応答の主導権を完全に握れます。
🧠 質疑応答を成功させる3つの事前準備
フレーズを覚えるだけでなく、想定質問の準備が質疑応答の成否を分けます。
① 想定Q&Aリストを3問作る
プレゼン内容から「聴衆が突っ込みそうな箇所」を3つ選び、回答を事前に用意します。数字の根拠、コスト比較、リスクの3点が最も狙われやすいポイントです。
② 「答えられない時」の逃げ道を決めておく
上記フレーズ8〜10のうち、自分が最も言いやすいものを1つ選んで暗記しておきます。いざという時に「使う逃げ道」が決まっていれば、パニックにはなりません。
③ AI英会話で質疑応答のロールプレイ
本番前にAI英会話アプリで「プレゼン後の質疑応答」を想定したロールプレイをすると、フレーズが口になじみます。1回5分でも効果は大きく違います。
📌 まとめ|質疑応答は「準備した人」が勝つ
この記事のポイント
- 質問を受けたら、まず感謝のフレーズで時間を稼ぐ
- 回答は確認→結論→具体例の順で構造的に
- 答えられない時は「フォローアップする」と約束する
- 質疑応答の進行は自分で仕切る(受け身にならない)
- 事前に想定Q&A 3問を用意しておく
質疑応答で止まってしまう症状は、英語力の問題ではなく、型の不足が原因です。この15フレーズを声に出して練習するだけで、次のプレゼンから確実に変わります。
❓ よくある質問
Q. 質問の意味がわからない時はどう対応すべきですか?
A. フレーズ5の「If I understand correctly, you’re asking about…」で質問を言い換えて確認します。わかったふりをせず確認することで、的外れな回答を防げます。
Q. 質疑応答の時間はどのくらい取ればいいですか?
A. プレゼン全体の20〜25%が目安です。15分のプレゼンなら3〜4分。冒頭で「質問は最後に受け付けます」と宣言しておくとスムーズです。
Q. 想定外の質問が来た時にパニックを防ぐ方法は?
A. フレーズ1で感謝を述べて時間を稼ぎ、答えられなければフレーズ9か10で後日回答を約束します。この逃げ道を事前に決めておくことが最大の対策です。
Q. 質疑応答のフレーズを効率的に覚える方法は?
A. まず各カテゴリから1つずつ(計4フレーズ)選んで暗記し、AI英会話でロールプレイ練習するのが最も効率的です。全15フレーズを一度に覚える必要はありません。
Q. 英語プレゼン自体の構成フレーズも知りたいのですが?
A. プレゼン本編のフレーズは別記事で場面別に解説しています。基本フレーズ30選から始めるのがおすすめです。
📚 フレーズの全体像を確認する
ビジネス英語フレーズ30選【音声付き】|10場面×厳選3フレーズ
会議・メール・交渉・プレゼン…全場面のフレーズを1ページで確認
Speakの始め方|登録から最初のレッスンまで5分ガイド【2026】
データプレゼンの英語表現を練習するなら、まずSpeakで型を反復。始め方はこちら。
📚 関連フレーズ記事
📚 次に読むべき実務ガイド
英語プレゼン基本フレーズ30選|構成と話し方
質疑応答の前に、プレゼン本編の構成フレーズを固めたい方へ
英語プレゼン例文70選|場面別コピペ大全
導入・本論・結論・質疑応答まで丸ごと使えるフレーズ集
英語プレゼン成功の秘訣|構成・緊張対策・質疑応答テンプレ
話し方と戦略で差をつけたい方向けの完全ガイド